DAY 1 EXERCISES
Oksana Riba-Grognuz
UNIX
First of all let's login to Vital-IT infrastructure. Each of you received a user name to use in the secure connection command below.
$ ssh username@prd.vital-it.ch
Now we are connected to a front-end node (prd.vital-it.ch) that can only be used to submit jobs to the Vital-IT cluster. For this practical we will be using 2 big-memory machines of the UNIL Department of Ecology and Evolution (dee-serv01 and dee-serv02). Half of you will connect to one of these machines and half to the other. Use the machine name you were assigned below.
$ ssh dee-serv0X
Once you get there check where you are with the command printing the current directory.
$ pwd
Alternatively, use the "echo" command to find out the address of your home directory. If you did not change your directory upon login this address should be the same as when you did "pwd".
$ echo $HOME
If you forgot which username you used, you can always check with the command below.
$ whoami
List file and directories in your location.
$ ls
Wherever you are located there is always an easy way to get back to home directory. Just type "cd" (change directory) without arguments.
How to get home?
$ cd
Adding bioinformatics software to your $PATH
To see what you programs you can run simply type the TAB key twice.
$ TAB TAB
Possible options are the program files found in locations specified in $PATH. What are these locations? Look at $PATH with "echo" command:
$ echo $PATH
Right now your $PATH is missing the software we will need. For this one would typically do the following:
$ export PATH="$PATH:/some/additional/software/location"
Vital-IT have prepared something that does this for you. So that it happens automatically when you login, you’ll need to edit the .bashrc in your home directory.
To see your .bashrc file with the command "ls" we need to add additional arguments, as this file is hidden by default.
$ ls -lah
Browse the contents of .bashrc using command "less".
$ less .bashrc
Does your .bashrc contain the following lines?
source /mnt/common/R-BioC/R-BioC.bashrc
source /mnt/common/DevTools/DevTools.bashrc
source /mnt/common/UHTS/UHTS.bashrc
These lines add to your $PATH the locations and configurations of R, and of Ultra High Throughput Sequencing (UHTS) applications. If they are missing from your .bashrc append them to .bashrc using ">>":
$ echo "source /mnt/common/R-BioC/R-BioC.bashrc" >> .bashrc
$ echo “source /mnt/common/DevTools/DevTools.bashrc” >> .bashrc
$ echo "source /mnt/common/UHTS/UHTS.bashrc" >> .bashrc
Now please logout and then ssh to the server again. Check how your $PATH has changed:
$ echo $PATH
Files and folders
If you are not familiar with file and folder operations try the following commands.
Make a new empty folder.
$ mkdir newfolder
Go to this folder.
$ cd newfolder
Go one folder back.
$ cd ..
$ rmdir newfolder
Make the folder again
$ mkdir newfolder
Create a file in that folder by redirecting printed output of "echo" command to a file.
$ echo "Some text" > newfolder/file.txt
Try removing the folder again
$ rmdir newfolder
Q: Why this does not work?
Try command "rm" (removes files and folders)
$ rm newfolder
This still does not work. Check in the manual (type "man" before the command) to see which parameters to put.
$ man rm
Editing files
Files can be edited locally on Vital-IT (using nano or vi or emacs), or on your laptop using a text editor of your choice (Aquamacs, TextWrangler... NOT Microsoft Word!). To edit a file locally you must first download it from Vital-IT. For this you can use scp (or Cyberduck or something like FileZilla).
For example, if you choose scp do the following locally on your computer:
$ mkdir Scripts
$ scp username@prd.vital-it.ch:/location/of/Scripts/MyScript.rb Scripts/
Once the script was modified upload it back to Vital-IT.
$ scp Scripts/MyScript.rb username@prd.vital-it.ch:/location/of/Scripts/
DATA ANALYSIS
We will be working on Solenopsis invicta (the red fire ant) using Illumina DNA and RNA-seq reads. For the official release of de novo genome assembly (Wurm et al. 2011, PNAS) we combined Illumina and 454 technologies in a hybrid assembly approach. For this course we will use only Illumina because it has become clear that it is possible to perform de novo genome assembly using only this technology. Furthermore, we are only considering for this practical a very small subset (less than 5%) of the fire ant genome.
Please form the groups of two (one more computational; one less computational). From now on you will use only one access to Vital-IT per group.
Login to Vital-IT. The command below connects first to the prd server and then to the dee server. We are only allowed to use ssh to connect to prd, but cannot use it for calculations.
$ ssh -t username@prd.vital-it.ch ssh dee-serv0X
According to the Vital-IT rules, no calculations can be carried out in the home directory. We will use /scratch/cluster/weekly/ for all practicals (files will be deleted after one week!). Create there a directory named according to your user-name and change from your home directory to this new directory.
$ mkdir /scratch/cluster/weekly/username
$ cd /scratch/cluster/weekly/username
Extract the files required for today's practical.
$ unzip /scratch/cluster/monthly/oribagro/summer2012_Oksana.zip
Quality Control: FastQC
We will use the FastQC package installed locally on your computer. We will analyse files located in DNA-seq/Raw/ and DNA-seq/Nr/. They are big. So please take a copy of these files from provided USB key or from the local web server (zipped as DNA-seq.zip). [probably http://192.168.167.32 ]
$ ls DNA-seq/Raw
$ ls DNA-seq/Nr
Our goal is to make decisions on de novo assembly strategy based on FastQC quality report. Open FastQC and open files to analyse. Process first Raw files, which are subsets of Illumina Hi-seq lanes as they came out of the sequencer.
Q: What do the file names mean?
Q: Do you think both lanes should be used for assembly?
Q: Do we need to trim or filter reads?
Q: Which information is important to take the decision about trimming/filtering?
Q: How can you explain a significant drop in the quality in the beginning of the reads of 2nd pair members of lane 7?
Process Nr reads now. Nr means “Non-redundant”: reads were processed to remove exact duplicates.
Q: Do you see a big change in duplications levels?
Q: What can be the reason for that (consider information given during presentation)?
Quality Control: FASTX-Toolkit
We will use FASTX-Toolkit to implement filtering/trimming decided in the previous step. This part takes place at Vital-IT. Process Raw or Nr (non-redundant) reads and output "clean" files to /scratch/cluster/weekly/username/DNA-seq/Clean. Toolkit allows us to do different types of filtering/trimming.
Find out how to trim reads based on coordinates:
$ fastx_trimmer -h
Find out how to trim/filter reads based on quality:
$ fastq_quality_trimmer –h
Use fastx_trimmer or fastq_quality_trimmer on each file individually (replace first base -f and/or last base -l values to desired trimming in the command below). Or alternatively use a provided launch script that will do the job on all files at once.
$ fastx_trimmer -f xxxx -l yyyy -i DNA-seq/Nr/101104_s_7_1.subset.fastq -o DNA-seq/Clean/101104_s_7_1.subset.fastq
$ fastx_trimmer -f xxxx -l yyyy -i DNA-seq/Nr/101104_s_7_2.subset.fastq -o DNA-seq/Clean/101104_s_7_2.subset.fastq
Ideally we want to remember what exactly was done to Raw data. A good way to achieve this is by doing all processing using bash wrapper scripts. You have an example of such script in Scripts folder. Another advantage of using scripts that execute the command on each input file automatically, is to handle large data sets comprised of multiple files.
$ less Scripts/run_fastx_trimmer.sh
This script should be launched in project directory containing DNA-seq directory in it. You can use vi or nano to modify this script on Vital-IT, or if you do not know how to use these, you can download this file to your local computer and modify using your preferred text editor to do what you judge necessary as trimming/filtering. Hint: you need to modify the line that launches fastx_trimmer command by adjusting trimming coordinates (-f xxx and -l yyy specifying the first and the last base respectively). If you forgot how to edit files, check the end of the UNIX introduction.
To launch the script you should go to the following folder on Vital-IT:
$ cd /scratch/cluster/weekly/username
$ Scripts/run_fastx_trimmer.sh
DE NOVO GENOME ASSEMBLY
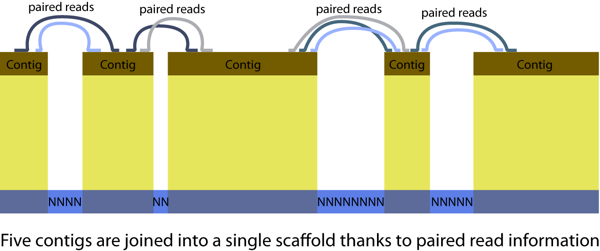
Few definitions are important for de novo assembly: contigs (contiguous sequences) and scaffolds, illustrated in the figure below. A genome assembly consists in hundreds to thousands of scaffolds.
We will use SOAPdenovo for genome assembly. Depending on genome characteristics different software might be the most appropriate. For the red fire ant data in 2009 SOAPdenovo was the best performing assembler of Illumina reads. To keep track of our actions and ensure the reproducibility of all steps we will rely on bash scripts to run assemblies. A usual approach to Illumina assembly is to do multiple assemblies using different combinations of data quality trimming/filtering and different assembler parameters. Due to time and resource constraints, each pair of students will only perform 2 or 3 assemblies.
Illumina assemblers rely on de Bruijn graph constructed from K-mers (K-length words) of all reads. This makes K-mer length a key software parameter to optimise.
SOAPdenovo package consists of four programs: pregraph, contig, map and scaff. Assembly with paired end reads involves the use of all four programs. Command "all" allows executing full SOAPdenovo package easily. We basically need to specify "SOAPdenovo all -s config_file -o output_prefix".
$ cd /scratch/cluster/weekly/username/SOAPdenovo/Assembly
This folder contains two files “conf01-lanes47_maplen60” and “Run_conf01-RL200D.sh”.
$ less conf01-lanes47_maplen60
$ less Run_conf01-RL200D.sh
Don’t run anything yet! Config file is created according to a format defined in SOAPdenovo requirements. Run_conf01-RL200D.sh will use config file to run SOAPdenovo with the specified parameters and config files and output results to folders named according to parameter values.
Check the explanations of commands and config file specifications at http://soap.genomics.org.cn/soapdenovo.html .
Modify conf01-lanes47_maplen60. You need at least to specify the correct location of input fastq files that you want to use (replace username). Optionally you can change some of the parameters.
Q: Can you trim reads within SOAPdenovo config file?
Modify Run_conf01-RL200D.sh. Use K-mer values of at least 1/3 of read length. Do not put more than three K-mer values as it will increase run time (Please do not run more than one assembly at a time - we are a big group of students sharing few compute resources).
Q: What are the different parameters used to run SOAPdenovo in Run_conf01-RL200D.sh
After you have edited the script, make sure you are in the correct folder and launch it:
$ ./Run_conf01-RL200D.sh
After the assembly is finished examine the contents of output folders. Look at the contents of LOG file form the assembly
$ less LOG
Files out.contig and out.scafSeq respectively contain FASTA format scaffold and contig sequences.
Optional
Q: What does asm_flags=3 in the config file mean?
There are multiple versions of SOAPdenovo. To see them, do:
$ SOAPdenovo TAB TAB
Q: Why are there several versions? When is it dangerous to use SOAPdenovo-127mer?
ASSESSING ASSEMBLY QUALITY
Comparing assembly metrics
A common way to select the optimal assembly strategy is to look at various types of statistics, like total number of assembled base pairs, number of scaffolds, N50 length, maximum scaffold length etc.
A script distributed with the assembly software Abyss called "abyss-fac" allows generating this kind of statistics.
Run abyss-fac script on results on one of your scaffolds files (replace the last assembly folder with the one you generated).
$ cd /scratch/cluster/weekly/username/SOAPdenovo/Assembly/conf01_K35_R_L200_D
$ abyss-fac out.scafSeq
Now run program called seqstat to generate statistics.
$ seqstat out.scafSeq
Q: Why do some numbers of seqstat differ from those generated with abyss-fac?
Q: Which do you find the most appropriate to use in selecting best assembly?
We can compare statistics between contig fasta and scaffold fasta using a cutoff equal to the value of -L parameter used in the assembly.
Run abyss-fac script on scaffolds again specifying -t 200 (the value of -L used in the assembly) as a cutoff for minimum scaffold length.
$ abyss-fac -t 200 out.scafSeq
Do the same for contigs
$ abyss-fac -t 200 out.contig
Q: Why is the number of bp not the same?
Optional (crucial for submitting genome assembly to NCBI)
In order to submit a newly assembled genome to a public database one needs to submit contig sequences and an AGP file specifying how these sequences are arranged in scaffolds. Scaffolds are built from contigs (contiguous sequences), that are joined by stretches of N bases using the information form paired reads with known insert size. Unfortunately SOAPdenovo, as most other de Brujin graph based programs does not provide such output and report a contig file with all sequences (regardless of inclusion in scaffolds). We can generate an AGP file containing only contigs that were used for scaffold construction by defining contigs based on stretches of N sequences within scaffolds.
$ /scratch/cluster/weekly/username/Scripts/fasta2agp.pl -f out.scafSeq -p out
This will generate files out.contigs.fa and out.agp. Run abyss-fac on new contigs file
$ abyss-fac -t 200 out.contigs.fa
Now the total number of bp is the same as in scaffold fasta file.
Have a look at AGP file. Read about format specifications at the following link: http://www.ncbi.nlm.nih.gov/projects/genome/assembly/agp/AGP_Specification.shtml
$ less out.agp
Often one would generate multiple assemblies to refine the strategy (many more than three). Although we have generated 2-3 assemblies, we will act as if we had a lot and process statistics from these files into R-readable format. We will save the file in folder called SOAPdenovo/Statistics .
$ cd /scratch/cluster/weekly/username/SOAPdenovo/Assembly
$ ./get.stats.sh > stats
Now use scp or other means to get file “stats” locally on your computer to use with R. If you obtained no statistics, modify the read.table command in what follows by replacing “stats” with “http://www.antgenomes.org/~yannickwurm/tmp/manyAssemblyStats.txt”.
Lets use R to find the best assembly in terms of quantitative metrics. Locally on your computer:
$ R
stats <- read.table("stats", header=T, sep="\t")
## get K-mer values from file name
myKmers <- substr(stats$file, 8,10)
## get config names
myConf <- as.numeric(substr(stats$file, 5,6))
## get all color names containing string "dark"
allColors <- colors()[grep("dark",colors())]
## randomly sample the neccessary number of colors
myColors <- sample(allColors, length(unique(myConf)))
## make vector of colors per assembly setting
confColors <- myColors[as.factor(myConf)]
configName <- paste("config", as.character(unique(myConf)), sep="")
## Lets plot this:
myTitle <- "N50 vs Number of contigs >= 200bp\nSize is proportional to total assembly bp"
plot(x = stats$n.200,
y = stats$N50,
cex = (stats$sum/1000000), # circle size
col = confColors,
pch = 19, # symbol "filled circle"
main = myTitle,
xlab = "Number of Contigs > = 200 bp",
ylab = "N50")
legend("topright", configName, col=unique(confColors), pch=19)
text(stats$n.200, stats$N50, myKmers, cex=0.7, col="white")
myTitle <- "N50 vs Number of contigs >= N50\nSize is proportional to total assembly bp"
plot(x = stats$n.N50,
y = stats$N50,
cex = (stats$sum/1000000),
col = confColors,
pch = 19,
main = myTitle,
xlab = "Number of Contigs >= N50",
ylab ="N50")
legend("topright", configName, col=unique(confColors), pch=19)
text(stats$n.N50, stats$N50, myKmers, cex=0.7, col="white")
## Finally make a plot with the values we expect to get.
## The same subset of data represented 3066758 bp accross eight
## scaffolds with N50 of 1867187
myTitle <- "N50 vs Number of contigs >= 200bp\nSize is proportional to total assembly bp"
plot(x = c(stats$n.200, 8),
y = c(stats$N50, 1867187),
cex = c(stats$sum, 3066758)/1000000,
col = c(confColors, "red"),
pch = 19,
main = myTitle,
xlab = "Number of Contigs >= 200 bp",
ylab ="N50")
legend("topright",
c(configName, "Official"),
col=unique(c(confColors,"red")),
pch=19)
Q: Which assembly is the best in terms of quantitative metrics?
Q: Why there is a significant difference with official release?
Quality assessment using independent information
Independently obtained information can provide the most reliable measures of whether or not your assembly is accurate.
- One approach involves mapping to your genome a conserved set of “core eukaryotic genes” that exist in exactly one single full copy in a broad range of eukaryotic genomes. Deviations from this provides quantitative estimations of the accuracy and likely completeness of your genome.
- Similar approaches can be used by mapping genome or proteome data from closely related species to your genome.
- Below, we use de novo assembled transcriptome information that we independently obtained from the same species, Solenopsis invicta. That will require first obtaining a transcriptome assembly.
DE NOVO TRANSCRIPTOME ASSEMBLY
We will use the Trinity software to assemble transcriptome from single Illumina reads:
$ cd /scratch/cluster/weekly/username/Trinity
First, check that your .bashrc contains the following line (if not, please add it)
source /mnt/common/DevTools/DevTools.bashrc
Have a look at options of Trinity.pl:
$ Trinity.pl -h
We have RNA-seq data for 3 conditions: males, queens and workers prefixed M, Q and W, respectively. Each condition is present in 4 replicates, numbers in file names indicate the ant colony from which the sample was taken. Due to time constraints we will restrict de novo assembly to a single RNA-seq file. Choose one RNA-seq file in /scratch/cluster/weekly/usernameRNA-seq/Raw/ and run Trinity on it. You can store the file name in variable rawRnaseqFile
$ rawRNAseqFile=/scratch/cluster/weekly/username/RNA-seq/Raw/Q415.subset.fastq
$ Trinity.pl --seqType fq --kmer_method jellyfish --max_memory 25G --CPU 1 --bflyCalculateCPU --single $rawRNAseqFile > stdout 2> stderr
If you do not manage to run Trinity, then copy its output as described below (make sure you are in the directory called “Trinity”):
$ mkdir -p trinity_out_dir
$ cp /scratch/cluster/monthly/oribagro/summer2012/Trinity/trinity_out_dir/Trinity.fasta trinity_out_dir/
Find out how many transcripts were assembled using “seqstat” or “abyss-fac”.
$ seqstat trinity_out_dir/Trinity.fasta
Optional
Q: How many genes are represented in the fasta file? Are you sure?
Q: What are the different steps of the Trinity pipeline?
CROSS-VALIDATION OF DE NOVO ASSEMBLIES
You will align transcripts assembled with Trinity to the genomic assembly that is best according to quantitative quality metrics. We will use a script that uses the BLAT aligner to generate alignment statistics and to construct network files. Network files include all cases where transcript is partially aligned on different scaffolds (non overlapping, complementary parts of transcript). Subsequently we will visualise the order inferred form such transcript alignments and the order of contigs in scaffolds. See more details at https://github.com/ksanao/TGNet .
Generate AGP file with scaffold structure (if you haven't already done so yet for the best assembly)
$ bestAssembly=conf01_K35_R_L200_D
$ runDir=/scratch/cluster/weekly/username
$ cd "$runDir"/SOAPdenovo/Assembly/"$bestAssembly"
$ "$runDir"/Scripts/fasta2agp.pl -f out.scafSeq -p out
$ cd "$runDir"
We will use a script that wraps the necessary commands: scaffold and contig files will be processed individually and result in two networks. Have a look in the script. The second paragraph of this script specifies that it will not execute unless provided a directory of best assembly. Try launching it without arguments.
$ less Scripts/run_TGNet.sh
$ Scripts/run_TGNet.sh
Finally launch the script providing it the directory with best assembly.
$ Scripts/run_TGNet.sh "$bestAssembly"
$ cd SOAPdenovo/Validation/"$bestAssembly"
The log.contigs and log.scaffolds files summarize what was done.
These files mention additional output files that will help you examine the following:
$ less out.contig.blat.stat
$ less out.scaffold.blat.stat
Q: How do you explain not all transcripts match over their full length?
Q: How do the statistics of mapping to scaffold and mapping to contigs differ? Why? What could be done to improve these numbers?
Choose one of the transcripts in cat out.scaffold.nw network file (column 2, tab delimited) and look up the alignments for this transcript in filtered and non-filtered blast output
$ myTranscript=`tail -1 out.scaffold.nw | cut -f2`
$ echo $myTranscript
$ grep $myTranscript out.scaffold.psl
$ grep $myTranscript out_filtered.scaffold.psl
Q: What does it mean when a transcripts aligns to multiple scaffolds or contigs? How can this information be useful?
Now download the whole /scratch/cluster/weekly/username/SOAPdenovo/Validation folder (including the network files you just created in "$bestAssembly" and TGNet.props) to your local computer for Cytoscape visualisation.
Run Cytoscape and import network files and visual properties file first for contigs network, then for scaffolds as described below.
Importing network
- From cytoscape menu select File, then Import and choose Network from Table option in drop-down menu
- Select file out.scaffold.nw (for scaffolds) or out.contig.nw (for contigs)
- Specify columns 1,2,3 as target, interaction, source respectfully (ie. backwards!), and enable all other columns
- Tick check-box Show Text File Import Options
- Tick check-box Transfer first line as attribute names
- Import
Importing node attributes
- From Cytoscape menu select File, then Import and choose Attribute from Table option in drop-down menu
- Select file out.scaffold.attr (for scaffolds) or out.contig.attr (for contigs)
- Tick check-box Show Text File Import Options
- Tick check-box Transfer first line as attribute names
- Import
Importing visual style
- From Cytoscape menu select File, then Import and choose Vizmap Property File
- Import a pre-built file TGNet.props
- From VizMapper menu select a style called TGNet
Network Layout
- From Cytoscape menu select Layout, then Cytoscape Layouts, then choose Force-Directed Layout, unweighted
Save your session (file.cys).
Q: Can transcript alignments confirm scaffolding in contigs network?
Q: Can your scaffolds be extended based on transcript alignment displayed in scaffold network?
Q: Do you have any problematic regions, potentially misassembled?
Optional:
Q: What else can Cytoscape be used for?